Financial Statements
What Is a Profit and Loss Statement? Example, Format and Formulas
A plain-English guide to the profit and loss statement: what it shows, a fully worked example, the key formulas, and how to prepare and read your own P&L.
By PilotLedger Team · · 8 min read
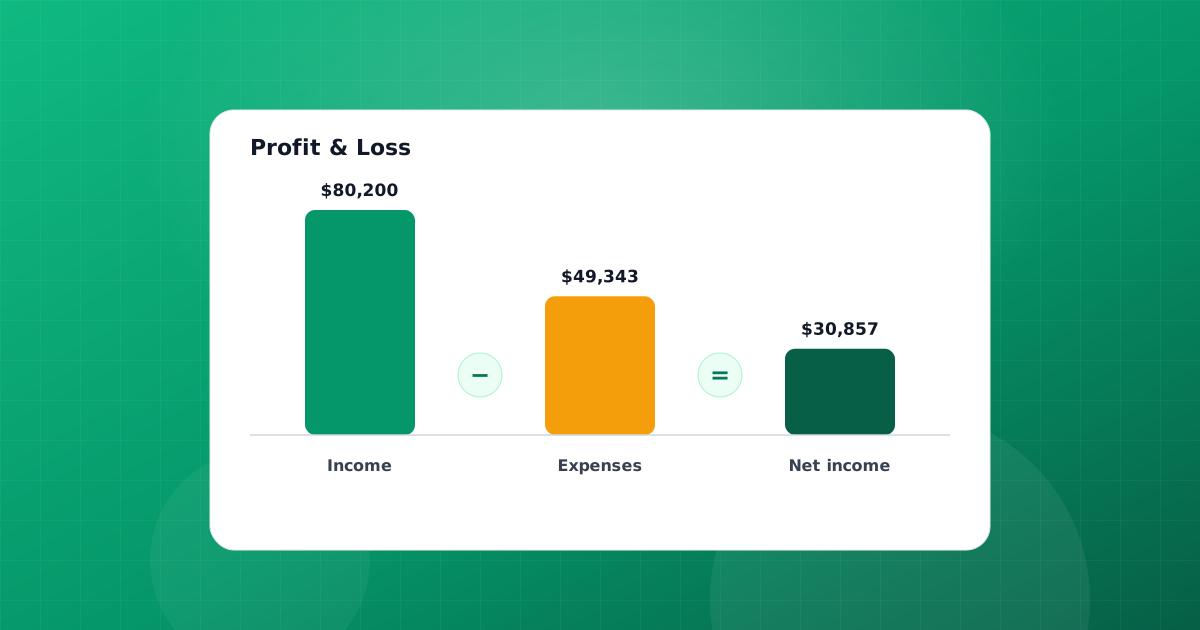
A profit and loss statement (P&L) is a financial report that shows a business's revenue, costs and expenses over a specific period, such as a month, quarter or year, and the profit or loss that results. It starts with sales at the top, subtracts the cost of what was sold to get gross profit, subtracts operating and other expenses, and ends with net income at the bottom. In short, it answers one question: did the business make money during this period, and how?
The P&L is one of the three core financial statements, alongside the balance sheet and the cash flow statement. Owners use it to track performance, lenders use it to judge whether a business can repay a loan, and tax preparers use it as the starting point for a business tax return.
Profit and loss statement vs income statement
There is no difference. "Profit and loss statement", "P&L", "income statement" and "statement of operations" all describe the same report. Larger companies and accountants tend to say income statement, while small business owners often say P&L. You may also hear "statement of earnings". Whatever the label, the structure is the same: revenue minus expenses equals profit or loss for a period.
The key thing that separates it from the balance sheet is time. A P&L covers a period, like January 1 to March 31. A balance sheet is a snapshot of what you own and owe on a single date.
What a profit and loss statement includes
Every P&L follows the same top-to-bottom logic. Here are the sections in order:
| Section | What it contains |
|---|---|
| Revenue (sales) | Income from selling goods or services, less returns and discounts |
| Cost of goods sold (COGS) | Direct costs of what you sold: inventory, materials, direct labor |
| Gross profit | Revenue minus COGS |
| Operating expenses | Costs of running the business: rent, wages, software, marketing, insurance, depreciation |
| Operating income | Gross profit minus operating expenses |
| Other income and expenses | Items outside normal operations, such as interest earned, interest paid, gains or losses on selling assets |
| Income before taxes | Operating income plus or minus other items |
| Income tax | Business income tax, where the business itself pays it |
| Net income | The bottom line: profit (or loss) for the period |
Service businesses often have little or no cost of goods sold, so their gross profit is close to their revenue.
Key profit and loss formulas
A few formulas do most of the work:
- Net revenue = Gross sales − Returns − Discounts
- Gross profit = Net revenue − Cost of goods sold
- Gross margin = Gross profit ÷ Net revenue × 100
- Operating income = Gross profit − Operating expenses
- Net income = Revenue − COGS − Operating expenses ± Other income and expenses − Taxes
- Net profit margin = Net income ÷ Net revenue × 100
Margins let you compare periods of different sizes. A business that grew sales but saw its gross margin fall from 62% to 55% has a pricing or cost problem worth investigating, even if total profit went up.
Profit and loss statement example
Here is a full worked example for a fictional small coffee roaster, Harbor Roasting Co., for the quarter ended September 30, 2026. It sells bagged coffee wholesale and online and also earns some revenue from catering events.
| Harbor Roasting Co. | Q3 2026 (Jul 1 – Sep 30) |
|---|---|
| Revenue | |
| Product sales | $120,000 |
| Catering services | $15,000 |
| Less: returns and discounts | ($2,000) |
| Net revenue | $133,000 |
| Cost of goods sold | |
| Green coffee, packaging and direct labor | ($52,000) |
| Gross profit | $81,000 |
| Operating expenses | |
| Wages (non-production staff) | $34,000 |
| Rent | $9,000 |
| Utilities | $2,400 |
| Marketing | $3,600 |
| Software and subscriptions | $900 |
| Insurance | $1,500 |
| Depreciation on roasting equipment | $2,100 |
| Total operating expenses | ($53,500) |
| Operating income | $27,500 |
| Other income and expenses | |
| Interest income | $100 |
| Interest expense on equipment loan | ($1,200) |
| Income before taxes | $26,400 |
| Income tax expense | ($5,500) |
| Net income | $20,900 |
Working through the formulas:
- Gross profit = $133,000 − $52,000 = $81,000
- Gross margin = $81,000 ÷ $133,000 = 60.9%
- Operating income = $81,000 − $53,500 = $27,500
- Net income = $27,500 + $100 − $1,200 − $5,500 = $20,900
- Net profit margin = $20,900 ÷ $133,000 = 15.7%
Two notes on the example. Depreciation appears as an expense even though no cash left the business this quarter, because the cost of the roaster is spread over its useful life. And the income tax line applies to businesses taxed as corporations; for sole proprietors and most partnerships and LLCs, profit passes through to the owners' personal returns, so the P&L usually ends at income before taxes.
How to make a profit and loss statement
You can build a P&L by hand in a spreadsheet or let accounting software generate it from your books. Either way, the steps are the same:
- Pick the period. Choose a month, quarter or year. Monthly P&Ls are the most useful for running a business.
- Total your revenue. Add up all sales for the period. On the accrual basis, count invoices issued; on the cash basis, count payments received. Subtract returns and discounts.
- Calculate cost of goods sold. For products, use beginning inventory + purchases − ending inventory, or the COGS your inventory system recorded. Service businesses may skip this line.
- Work out gross profit. Subtract COGS from net revenue.
- List operating expenses by category. Use the expense accounts from your chart of accounts, such as rent, wages, software and marketing.
- Subtract operating expenses to get operating income.
- Add other income and subtract other expenses, such as interest.
- Subtract income tax if the business pays it directly.
- Arrive at net income and check the totals.
If you prefer a spreadsheet, our free profit and loss template has the layout and formulas ready. The catch with a spreadsheet is that every number must be collected and typed by hand, so it is only as accurate as the records behind it.
Accounting software avoids that. Because every invoice, bill, expense and journal entry posts to the general ledger, the P&L is always up to date. In PilotLedger, the Profit & Loss report is one of 11 financial reports, runs for any date range and can be exported. With inventory tracking turned on, cost of goods sold is posted automatically each time you invoice a tracked item.
A simpler example for a service business
Not every business sells products. Here is a monthly P&L for a freelance web developer working as a sole proprietor, for October 2026. With no inventory there is no cost of goods sold, so gross profit equals revenue, and because profit passes through to the owner's personal return, there is no income tax line.
| Rivera Web Studio | October 2026 |
|---|---|
| Client project revenue | $9,800 |
| Hosting and maintenance retainers | $1,200 |
| Total revenue | $11,000 |
| Contractor fees | $2,400 |
| Software and subscriptions | $310 |
| Coworking membership | $350 |
| Advertising | $250 |
| Professional development | $120 |
| Bank and payment fees | $90 |
| Phone and internet | $130 |
| Total expenses | ($3,650) |
| Net income | $7,350 |
Net profit margin here is $7,350 ÷ $11,000, or about 66.8%. That figure is before the owner's self-employment and income taxes, which is why a sole proprietor should set aside a share of each month's profit for estimated tax payments rather than treating the whole amount as spendable.
Cash basis vs accrual basis P&L
The same business can produce two different P&Ls for the same month depending on the accounting method.
| Cash-basis P&L | Accrual-basis P&L | |
|---|---|---|
| Revenue counted | Payments received in the period | Invoices issued (work earned) in the period |
| Expenses counted | Bills and expenses paid in the period | Bills and expenses incurred in the period |
| Strength | Simple and close to your bank balance | Matches income with the costs of earning it |
| Weakness | Profit swings with payment timing | Profit can look healthy while cash is tight |
Say you invoice $8,000 in September and the customer pays in October. On the cash basis, the $8,000 is October revenue; on the accrual basis, it is September revenue. Pick one method and use it consistently, and always label which method a P&L uses when you share it with a lender or accountant.
How to read and use your P&L
A P&L is most useful when you compare it, not when you read it in isolation.
- Compare with the previous period. Is revenue growing? Did any expense jump?
- Compare with the same period last year. This removes seasonal swings, which matter a lot for businesses like retail and hospitality.
- Watch gross margin. A falling margin means costs are rising faster than prices, or the mix of what you sell has shifted.
- Check expenses as a percentage of revenue. Rent at 7% of revenue is fine; rent at 20% is a warning sign.
- Look at the trend, not one month. One bad month can be noise. Three in a row is a pattern.
What the P&L does not tell you
A profitable P&L does not guarantee healthy cash. Under accrual accounting, an invoice counts as revenue the day you issue it, even if the customer pays in 60 days. Loan repayments of principal, equipment purchases and owner draws do not appear on the P&L at all, but they all use cash. That is why you should read the P&L alongside the cash flow statement and an aging report of unpaid invoices. A business can show a profit and still run out of money.
Common P&L mistakes
- Recording owner draws or loan principal payments as expenses.
- Counting sales tax collected as revenue (it is a liability you owe to the state).
- Putting large equipment purchases straight into expenses instead of recording them as assets and depreciating them.
- Mixing personal and business costs.
- Comparing a cash-basis P&L with an accrual-basis P&L from another period.
A monthly P&L, built from well-kept books, is the clearest picture of whether your business is working. Read it every month, compare it with last month and last year, and act on what changes. For the routine that keeps the numbers reliable, see our small business bookkeeping guide.