Accounting Basics
Chart of Accounts: What It Is, Example and Sample for Small Business
Learn what a chart of accounts is, how account numbering works, and copy a sample chart of accounts built for a typical small business, plus setup tips.
By PilotLedger Team · · 8 min read
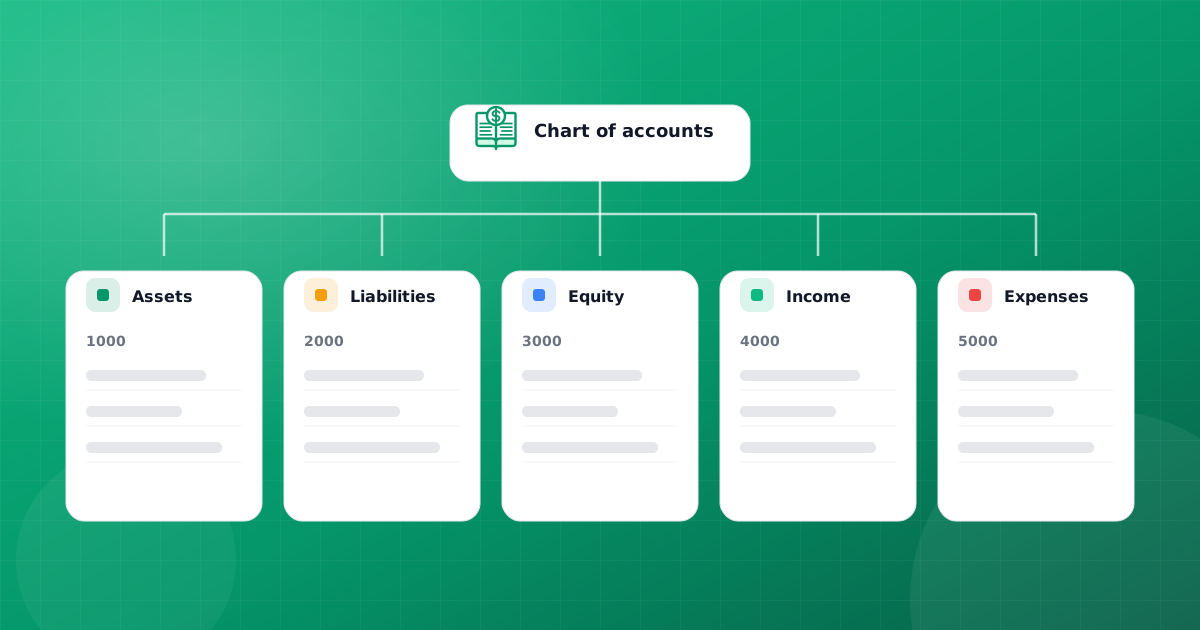
A chart of accounts (COA) is the complete, numbered list of every account a business uses to record its transactions, grouped into five types: assets, liabilities, equity, revenue and expenses. Each account, such as "Business checking", "Accounts receivable" or "Rent expense", gets a name and usually a number. Every transaction you record is sorted into these accounts, and your financial statements are built directly from them. Think of it as the filing system for your money.
A well-designed chart of accounts makes bookkeeping faster and reports more useful. A messy one, with duplicate accounts or vague catch-all categories, makes it hard to see where money goes and creates extra work at tax time.
What is a chart of accounts used for?
Your chart of accounts sits underneath everything in your books:
- Recording transactions. Every invoice, bill, expense and journal entry is posted to at least two accounts under double-entry accounting.
- Building reports. The balance sheet is built from asset, liability and equity accounts. The profit and loss statement is built from revenue and expense accounts.
- Preparing taxes. When expense accounts line up with tax return categories, your accountant can prepare returns with less rework.
- Comparing periods. A stable chart means this year's numbers are directly comparable with last year's.
Each account's running history lives in the general ledger. The chart of accounts is the index; the ledger is the detail.
The five account types
All accounts fall into one of five types, linked by the accounting equation: Assets = Liabilities + Equity. Revenue increases equity and expenses reduce it, so they feed into the equation through profit.
| Type | What it tracks | Normal balance | Appears on |
|---|---|---|---|
| Assets | What the business owns or is owed | Debit | Balance sheet |
| Liabilities | What the business owes others | Credit | Balance sheet |
| Equity | The owners' stake in the business | Credit | Balance sheet |
| Revenue | Income earned from sales and services | Credit | Profit and loss |
| Expenses | Costs of running the business | Debit | Profit and loss |
"Normal balance" tells you which side increases the account. If debits and credits are new to you, our accounting basics guide explains them with examples.
Chart of accounts numbering scheme
Most charts use a numbering scheme where the first digit identifies the account type. This keeps related accounts together and makes it easy to tell what an account is from its number alone.
| Number range | Account type | Examples |
|---|---|---|
| 1000–1999 | Assets | Cash, accounts receivable, inventory, equipment |
| 2000–2999 | Liabilities | Accounts payable, credit cards, sales tax payable, loans |
| 3000–3999 | Equity | Owner's capital, owner's draw, retained earnings |
| 4000–4999 | Revenue | Product sales, service revenue, other income |
| 5000–5999 | Cost of goods sold | Materials, inventory cost, direct labor |
| 6000–6999 | Operating expenses | Rent, wages, software, marketing, insurance |
| 7000–7999 | Other income and expenses | Interest income, interest expense, exchange gains and losses |
Some small businesses keep it simpler and put all expenses, including cost of goods sold, in the 5000s. Either approach works. What matters is consistency.
Within each range, order accounts logically. Assets usually run from most liquid (cash) to least liquid (equipment). Liabilities run from short-term (accounts payable) to long-term (loans). Leave gaps between numbers, for example counting by 10s (1010, 1020, 1030), so you can insert new accounts later without renumbering.
Chart of accounts example for a small business
Here is a chart of accounts sample for a small business that sells both products and services. You can adapt it by removing accounts you do not need and adding a few that are specific to your industry.
| Number | Account name | Type |
|---|---|---|
| 1010 | Business checking | Asset |
| 1020 | Business savings | Asset |
| 1030 | Petty cash | Asset |
| 1200 | Accounts receivable | Asset |
| 1300 | Inventory | Asset |
| 1400 | Prepaid expenses | Asset |
| 1500 | Equipment | Asset |
| 1510 | Accumulated depreciation, equipment | Asset (contra) |
| 1600 | Vehicles | Asset |
| 2010 | Accounts payable | Liability |
| 2100 | Business credit card | Liability |
| 2200 | Sales tax payable | Liability |
| 2300 | Payroll liabilities | Liability |
| 2400 | Accrued expenses | Liability |
| 2700 | Equipment loan | Liability |
| 3010 | Owner's capital | Equity |
| 3020 | Owner's draw | Equity |
| 3900 | Retained earnings | Equity |
| 4010 | Product sales | Revenue |
| 4020 | Service revenue | Revenue |
| 4900 | Sales discounts and returns | Revenue (contra) |
| 5010 | Cost of goods sold | Cost of goods sold |
| 5020 | Freight and shipping in | Cost of goods sold |
| 6010 | Rent | Expense |
| 6020 | Utilities | Expense |
| 6030 | Wages and salaries | Expense |
| 6040 | Payroll taxes | Expense |
| 6100 | Advertising and marketing | Expense |
| 6200 | Software and subscriptions | Expense |
| 6300 | Insurance | Expense |
| 6400 | Office supplies | Expense |
| 6500 | Professional fees | Expense |
| 6600 | Travel | Expense |
| 6700 | Meals | Expense |
| 6800 | Bank and payment processing fees | Expense |
| 6900 | Depreciation expense | Expense |
| 7010 | Interest income | Other income |
| 7020 | Interest expense | Other expense |
| 7030 | Exchange gain or loss | Other income/expense |
Two entries worth explaining. A contra account carries the opposite balance of its group: accumulated depreciation reduces the value of equipment, and sales discounts reduce revenue. And payroll accounts only matter if you run payroll; a freelancer with no employees can drop them.
Simpler example for a freelancer
A solo service business can get by with far fewer accounts: business checking, accounts receivable, business credit card, sales tax payable (if applicable), owner's capital, owner's draw, retained earnings, service revenue, and a dozen expense accounts that match the business expense lines on the tax return. Start lean and add detail when a report question demands it.
Industry variations
The core structure stays the same in every business, but the detail changes with what you sell. A few common adjustments:
| Business type | Accounts to add or expand |
|---|---|
| Retail or ecommerce | Inventory by category, merchant fees, shipping out, sales returns, marketplace fees |
| Construction and trades | Materials, subcontractors, equipment rental, retainage receivable, job supplies |
| Agencies and consultants | Revenue by service line, contractor fees, reimbursable client expenses |
| Restaurants and food | Food cost, beverage cost, packaging, tips payable, kitchen equipment |
| Businesses selling abroad | Foreign currency bank accounts, exchange gains and losses |
Resist the urge to track everything through accounts. If you want to see revenue by customer or by product, use customer and item records and run sales reports by customer or by item. The chart of accounts should answer "what kind of money is this", while your sales and purchase records answer "who" and "what exactly".
How transactions flow through the chart of accounts
It helps to see how a single sale touches several accounts. Suppose you sell a product for $500 plus $40 sales tax, and the item cost you $300.
| Account | Debit | Credit |
|---|---|---|
| 1200 Accounts receivable | $540 | |
| 4010 Product sales | $500 | |
| 2200 Sales tax payable | $40 | |
| 5010 Cost of goods sold | $300 | |
| 1300 Inventory | $300 |
Five accounts change from one invoice: receivables and sales tax on the balance sheet, sales on the P&L, and inventory moves into cost of goods sold. When the customer pays, cash rises and receivables fall. If your chart is well organized, each of these lands in an obvious place, and your reports are right without extra effort.
How to set up your chart of accounts
- Start from a standard template. Most accounting software ships with a default chart. Use it as a base rather than building from scratch.
- Match your tax return. Name expense accounts so each one maps cleanly to a line on your business tax form.
- Add only what you will report on. If you never need to see "Coffee" separately from "Office supplies", do not create it.
- Set up bank and card accounts first. Each real bank account and credit card should have its own account in the chart so you can reconcile it.
- Enter opening balances if the business was already running.
- Ask your accountant to review it before you start recording transactions.
Signs your chart of accounts needs a cleanup
Charts tend to grow untidy over time, especially when several people add accounts. Watch for these warning signs:
- Two or more accounts that mean the same thing, such as "Software", "Subscriptions" and "SaaS tools".
- A "Miscellaneous" or "Uncategorized" account with a large balance.
- Accounts named after individual customers, vendors or projects.
- Expense accounts that do not match any line on your tax return, so your accountant has to regroup them every year.
- Inactive accounts with no transactions for several years still cluttering the list.
The fix is usually simple: pick one account to keep, move future transactions there, deactivate the duplicates, and ask your accountant whether past balances should be reclassified with a journal entry.
Tips for maintaining a clean chart of accounts
- Avoid "Miscellaneous" for anything material. If an amount matters, it deserves a real account.
- Deactivate rather than delete accounts that have history, so past reports remain accurate.
- Do not create an account per customer or vendor. Use customer and vendor records for that detail and keep one accounts receivable and one accounts payable account.
- Review it once a year, ideally before your fiscal year starts, so changes apply to a full year.
- Keep naming consistent, such as always using "expense" or never using it, so lists sort cleanly.
- Restrict who can add accounts on a team, so the chart does not sprawl.
Your chart of accounts in PilotLedger
PilotLedger is built on a real double-entry ledger, so the chart of accounts is at its center. Every organization starts with a standard small-business chart that you can edit: add accounts, rename them, and organize them by type. Invoices, bills, expenses, payments and manual journal entries all post to these accounts automatically, and reports such as the trial balance, balance sheet and profit and loss are generated directly from them. See double-entry accounting for how the ledger, journals and reports fit together, and financial reports for the full report list.
A good chart of accounts is simple, consistent and built around the questions you want your books to answer. Set it up carefully once, review it yearly, and it will quietly make every other bookkeeping task easier. Our small business bookkeeping guide shows how it fits into a weekly and monthly routine.